You've grown fast. See what's changed, and where you stand now
Fast growth rarely breaks an organisation outright. More often it stretches things quietly - the shared understanding that once went without saying, the ways of working built for a smaller place - in ways that are hard to see from the inside. States of Vitality gives you a clear baseline of where you stand now, and shows what the growth has changed.
What's hardest to see
When an organisation is small, a lot holds it together that nobody has to manage - people know each other, direction is obvious, decisions happen in a corridor.
Growth changes that quietly. The things that were free at thirty people - shared context, trust, a common sense of where things are heading - need rebuilding at two hundred, and the gap opens slowly enough that it's hard to see from the inside. By the time it shows as friction or slipping momentum, the drift is already well established.
of fast-growing organisations name diluting their culture as their biggest concern.
Growth doesn't announce what it's costing you. By the time you feel it, it has usually already set in.
What States of Vitality shows you
We take one short, anonymous read across the whole organisation and give you a clear baseline - where it stands today, across eight connected dimensions of organisational health. You see which foundations have held as you have grown and which have thinned: whether direction is still shared or has blurred with scale, whether the culture that defined you early on is still felt on the ground, whether information still reaches people or gets lost in the new layers, and whether the way work flows has kept pace.
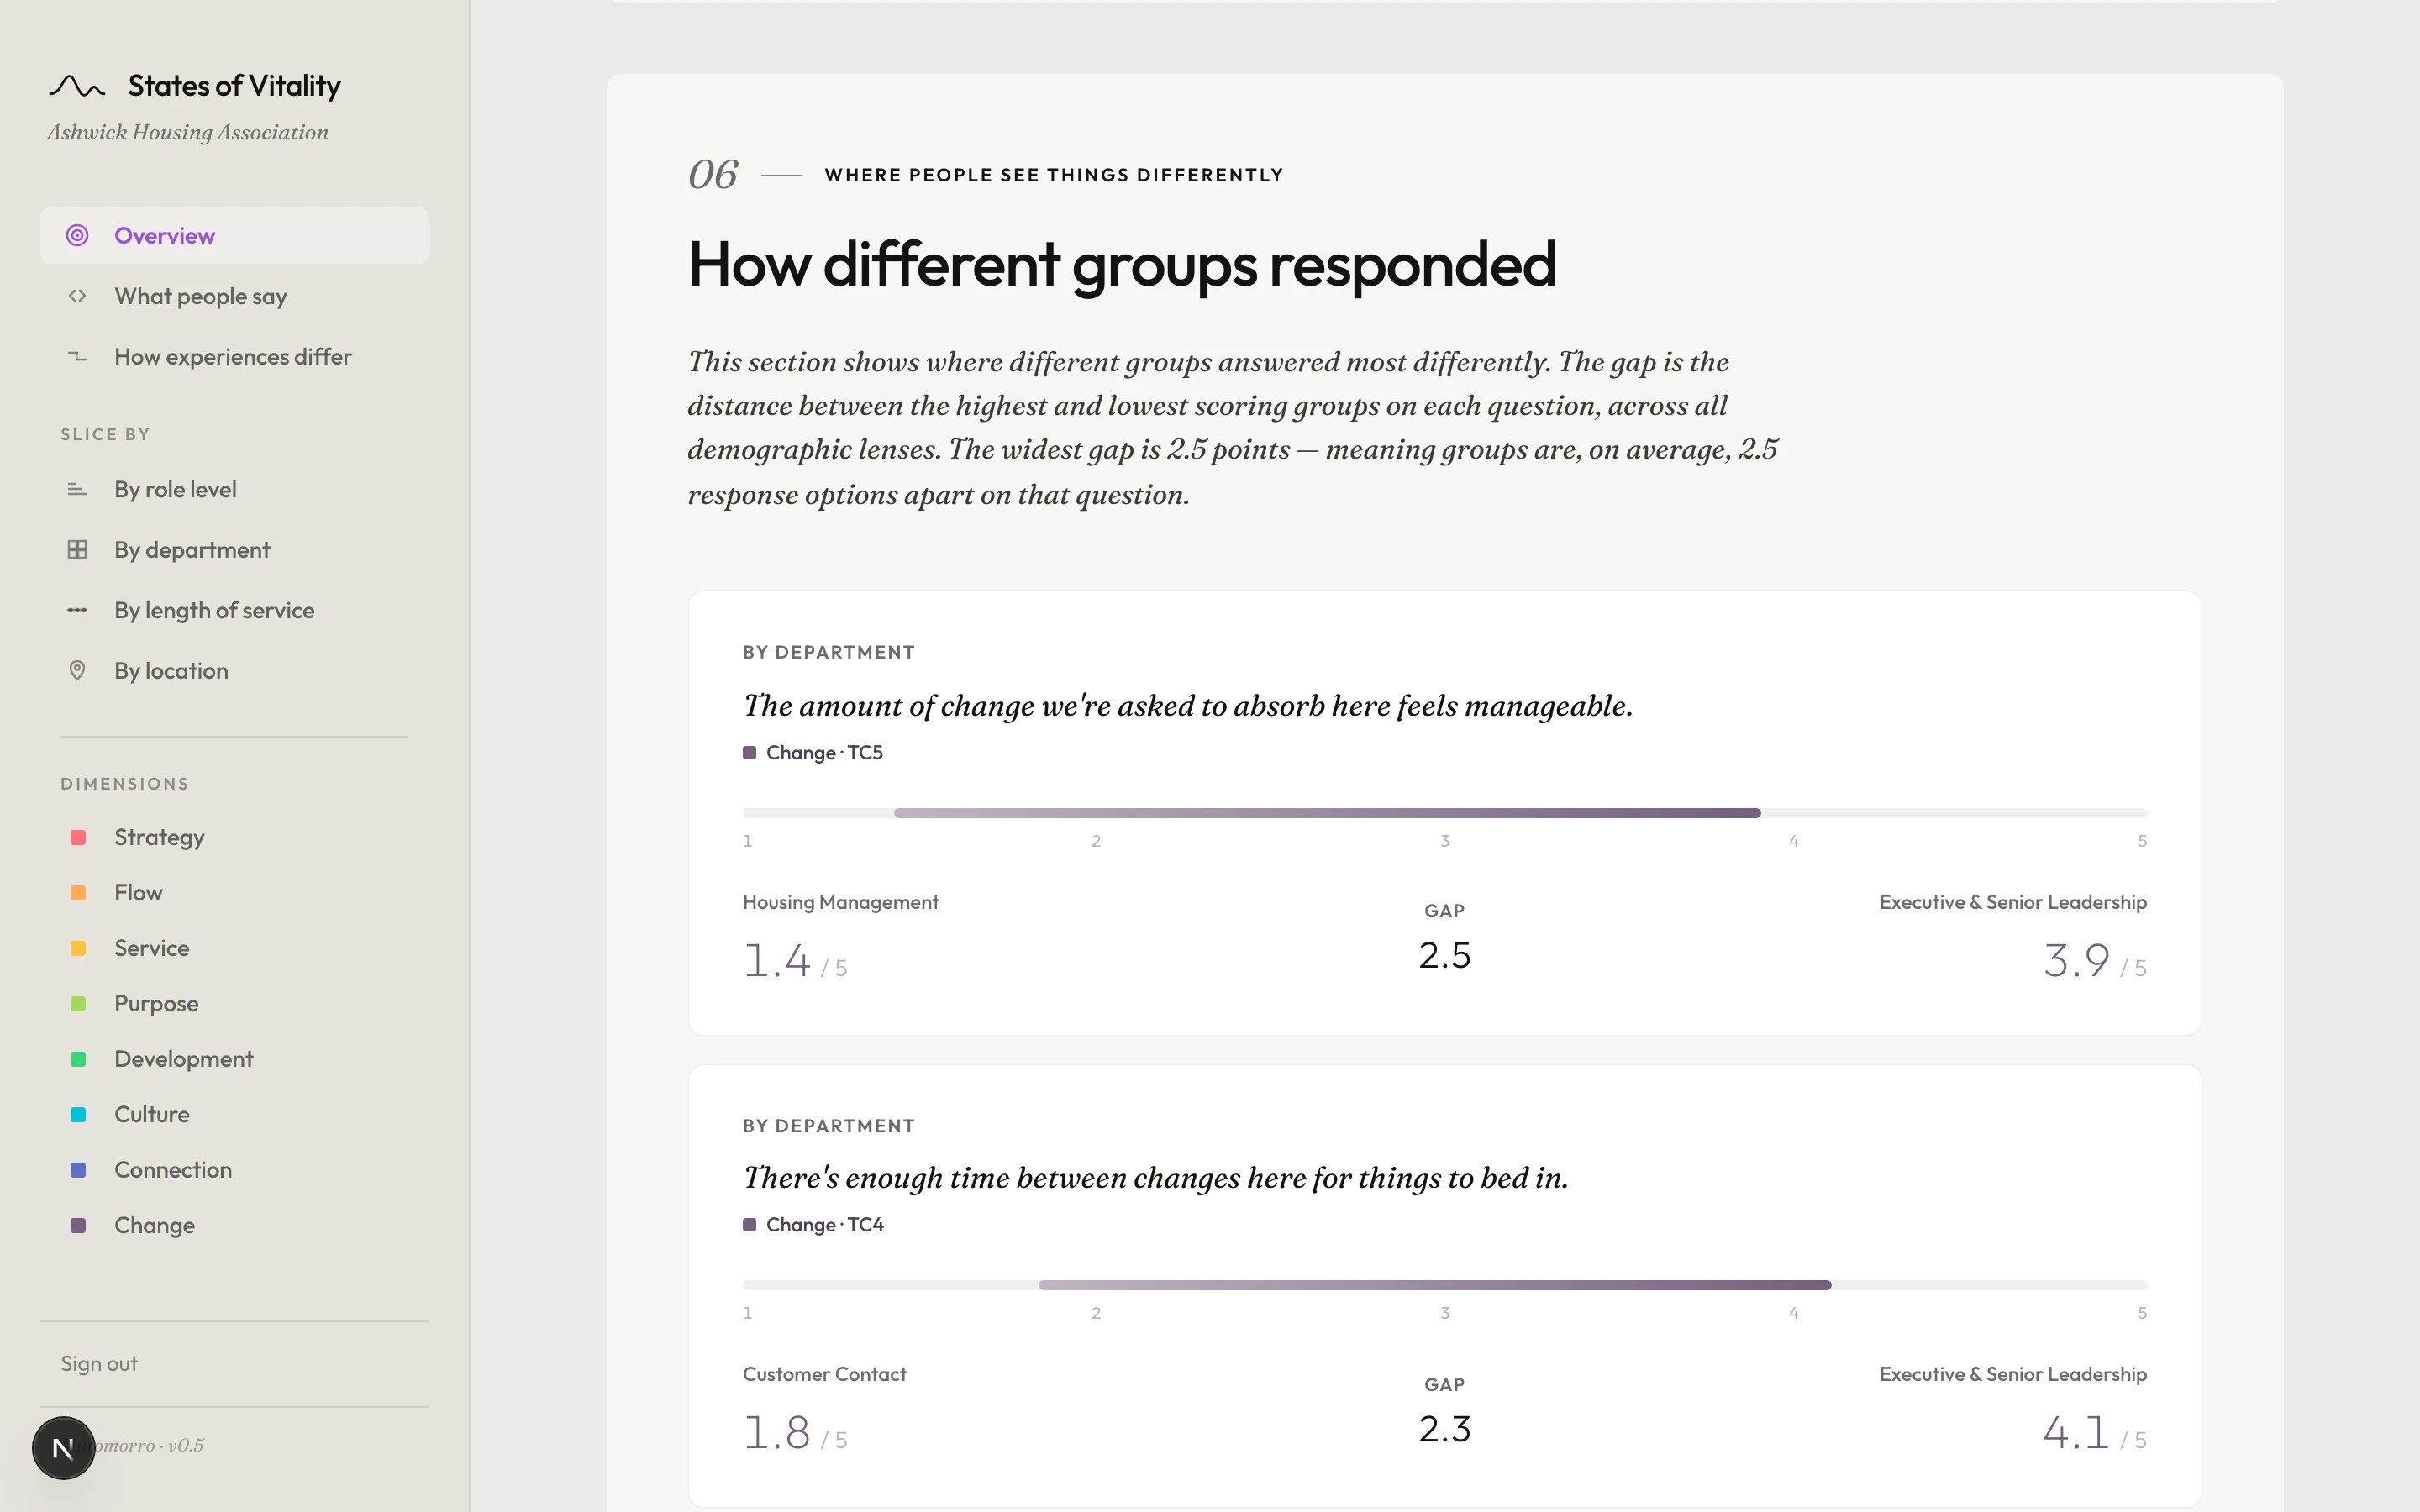
Because it is broken down by group, you can see where the drift has concentrated - which teams, levels or locations have moved furthest from the rest - and because it is a whole-workforce read, you can see how far the view from the top sits from the view on the front line.
What you'd see in the dashboard
Every dimension scored and ranked, so your baseline is clear at a glance.
A heatmap of every group against every area, surfacing where a group has drifted furthest from the rest.
Compare any two groups - department, level, tenure, location - side by side, to see where growth has pulled the organisation apart.
What people wrote themselves about what has changed as you have grown - read directly, not summarised away.
Grown fast, and need a baseline?
We can talk through what a clear read of where the organisation stands now would look like - scope, timing and price.