See your whole organisation clearly
A managed organisational health diagnostic. Designed to read key dimensions across your organisation - the whole picture, the story beneath the scores, and where to focus - so you can see clearly, and shape what comes next.
A product by Mutomorro.
The one-minute tour
What States of Vitality reveals, start to finish - from the eight dimensions and the scores beneath them, to where different groups experience the same workplace differently.
Runs about a minute, best with sound on.
From isolated scores to the stories underneath
Organisations we work with are often already collecting data from their people.
What these numbers rarely tell you is how they connect - or the picture they add up to. A score gives you a snapshot. It rarely tells you the whole story: the shape of how your organisation is doing, and where to put your attention.
That's where States of Vitality begins.
Illustrative - the kind of numbers that rarely add up to a picture on their own.
For organisations that want more than a survey
States of Vitality brings the voices and views from across your organisation into one clear picture - where you are, and where to focus.
Combined, it's a picture clear enough to act on - one that shows which conditions help people do their best work, and which quietly hold them back.
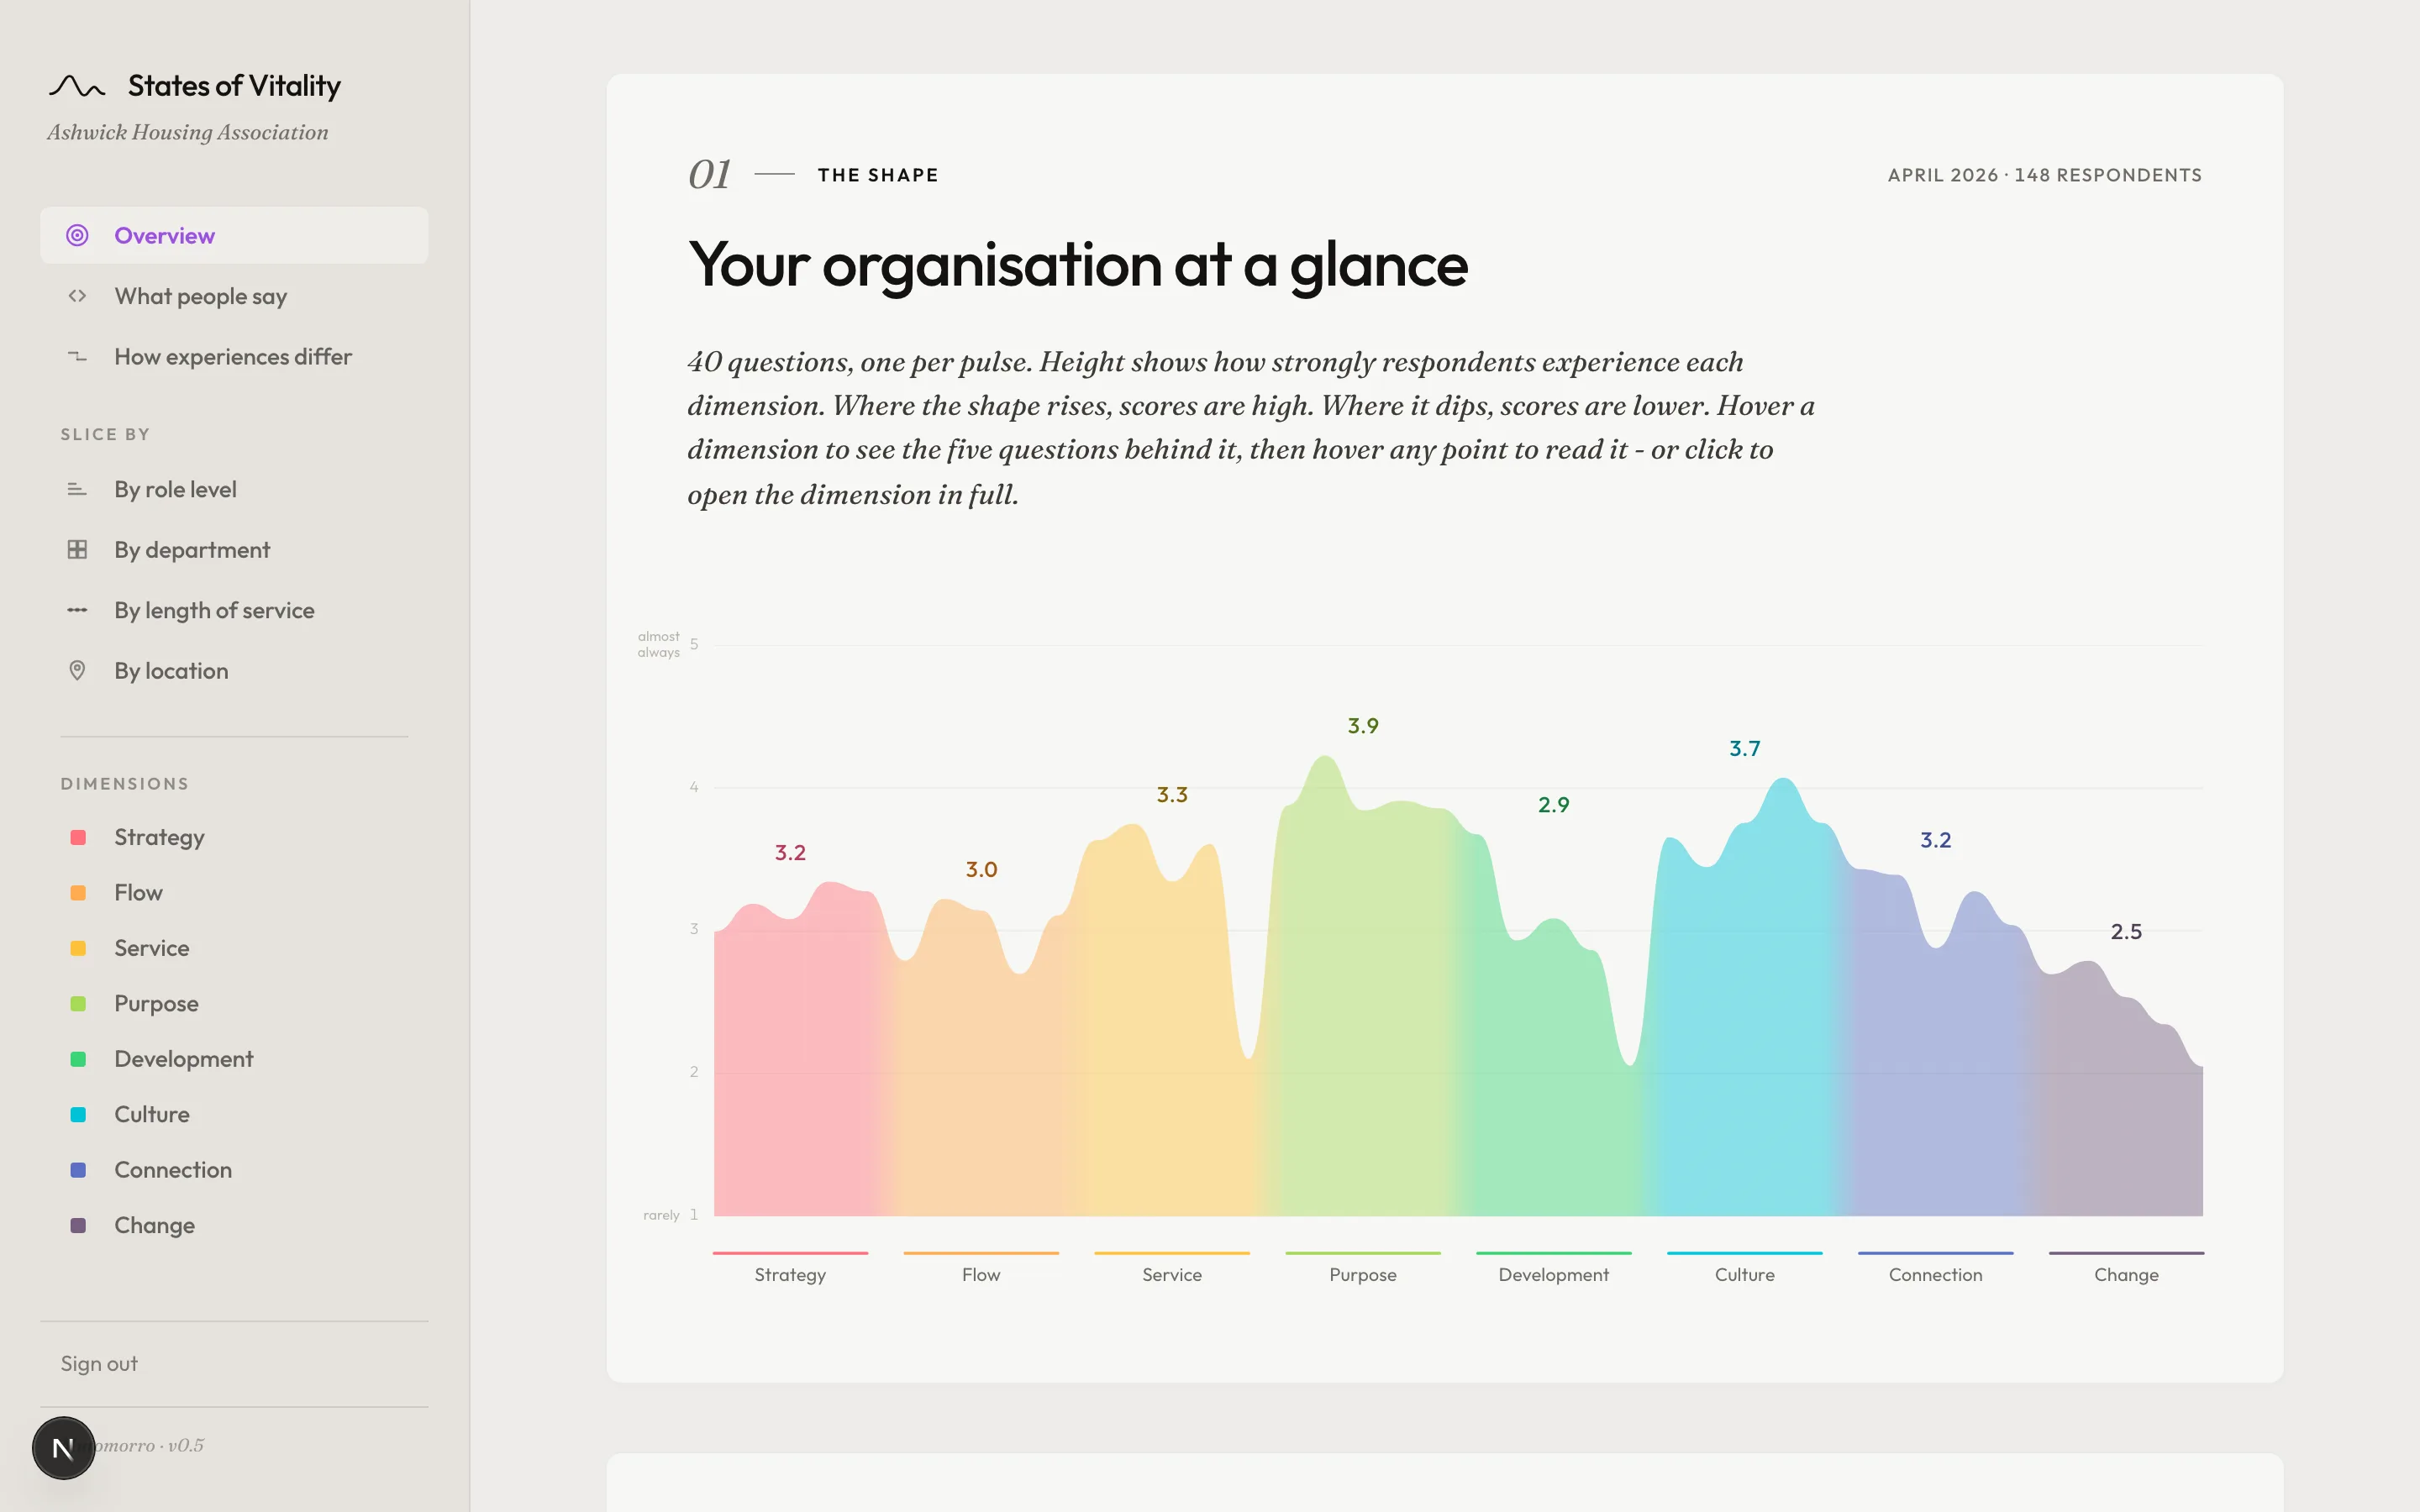
Eight dimensions of organisational health
A thriving organisation isn't one thing - it's a set of conditions working together. States of Vitality measures eight, each read across five distinct angles, as one connected system.
- Strategy
- Flow
- Service
- Purpose
- Development
- Culture
- Connection
- Change
See it for yourself
Results arrive in an interactive dashboard you explore - not a report you wait for. Two organisations can share the same average and tell completely different stories. The shape is where the story lives.
Helping you uncover the signals in the differences
Different groups can experience an organisation very differently. SHRM's 2024 global culture study found exactly that: 82% of executives rated their culture good or excellent - and only 47% of individual contributors did. The same organisation, seen from two very different places.
States of Vitality is designed to uncover those insights. The signals in the data that averages hide. Real value is rarely in the averages, it's in the space between them.
We've built the diagnostic to surface exactly that. It shows where your own organisation diverges - by seniority, by team, by how long people have been here - so the gaps come into view instead of being averaged away. The perception gap stops being a general truth about workplaces and becomes a specific thing you can see in yours.
And it works because everyone takes part. A gap between two groups is only trustworthy if both groups had a voice - so the assessment goes to the whole organisation, not a sample.
A gap you can't see is a gap you can't close. No single position sees the whole organisation - the view from the top and the view from the front line are genuinely different - so when that difference stays hidden, the conditions holding people back stay hidden too. Seeing it is how you lead the organisation as it is, not as it looks from one perspective.
One diagnostic, multiple applications
Because of how States of Vitality works, it's suitable in a range of organisational situations. Often where something is about to shift, and seeing the ground clearly matters before the first move.
Is strategy embedded, or just on paper?
Culture changeUnderstand your culture before you change it.
Transformation planningKnow what you're working with before you begin.
Merger or acquisitionSee how two organisations really function.
Scaling and growthKnow what holds as you grow.
Leadership transitionShow new leaders what they've inherited.
Employee experienceGo deeper than engagement scores.
Customer experienceHow internal dynamics reach customers.
Post-change reviewSee whether previous changes have embedded.
We've designed it to suit organisations from around 50 to 1,500+ people, and it works across different sectors, structures and geographies.
How it works
Managed end to end - we set it up, run it, and deliver the results. Four steps, from first conversation to a picture you can act on.
- STEP 01
We set it up.
- STEP 02
Your people respond.
- STEP 03
You get your dashboard.
- STEP 04
Go further, if you want.
A fully managed diagnostic
Everything included, priced by organisation size - the survey, the interactive dashboard, demographic analysis and freeform responses, all in. No tiers, no feature gates.
Frequently asked questions
How long does the whole process take?
Most assessments run from setup to dashboard in around 3-4 weeks. Setup takes a day or two, the survey window is typically 2-3 weeks (to give everyone time to respond), and we publish your dashboard within a few days of closing.
Is the survey anonymous?
Yes, completely. We collect demographic information (department, role level, length of service, location) to enable group-level analysis, but individual responses are never identifiable. No names are attached to answers.
How many people need to respond for meaningful results?
We recommend a minimum response rate of around 60-70% for the overall results to feel representative. For demographic breakdowns (e.g. by department), you need enough responses in each group to make the comparison meaningful - typically 5 or more per group.
What size organisation is this designed for?
States of Vitality is designed for organisations from around 50 to 1,500+ people, and it works across different sectors, structures and geographies. If you're outside that range, get in touch - we can advise on whether it's the right fit.
Can we repeat the assessment to track progress?
Yes. Running the assessment again after 12-18 months gives you a clear picture of what has shifted. The dashboard makes it easy to compare results over time.
What if we have recently done an engagement survey?
That's fine - this isn't an engagement survey. States of Vitality measures organisational health across eight dimensions, not individual satisfaction. The two complement each other well. If anything, recent engagement data gives you useful context for reading the results.
Do you need access to our systems?
No. The survey is hosted by us and respondents access it via a simple link and access code. We do not need access to your email systems, HR platforms, or internal tools.
What happens after we receive the dashboard?
Your leadership team can explore the results at their own pace - the dashboard is designed to be self-explanatory. If you'd like guided support, we offer an optional walkthrough session to help you read the shape, understand the patterns, and plan your response.
Who sees the results?
Only the people you choose. Access is controlled through secure email-based login. You decide who in your organisation gets access to the dashboard.
How is this different from a staff engagement survey?
Engagement surveys typically ask how satisfied or motivated individuals feel. States of Vitality measures how the organisation itself is functioning - across strategy, operations, culture, change, and more. It reveals systemic patterns (like perception gaps between levels) that engagement surveys are not designed to surface. Think of it as a health check for the organisation, not a mood check for individuals.
Is our data secure and GDPR compliant?
Yes. Survey responses are stored securely and processed in accordance with UK GDPR. Responses are anonymous - no names are attached to individual answers. We collect demographic information (department, role level, length of service, location) for group-level analysis only, and groups are never small enough to identify individuals. Your data is hosted on EU-based infrastructure and is never shared with third parties. We can provide a data processing agreement on request.