We run it. You explore the results.
Managed end to end. From first conversation to a picture you can act on.
States of Vitality is not a platform you log into and figure out. We set it up, run it, and deliver the results - so you can focus on what the data shows you, not on how to get it.
We talk
We start with a conversation about your organisation - what is going on, what you want to understand, and what would make this useful. No forms, no self-serve setup. A conversation.
This is where we learn what to configure: your departments, role levels, length-of-service bands, locations, and the word your organisation uses for the people it serves - residents, customers, patients, clients, members. The assessment uses your language, not ours.
We set it up
We configure the assessment for your organisation and agree a timeline - when the survey opens, how long it runs, and when the results will be ready. We handle the setup, the survey platform, and the branded communications your people will receive.
You provide a list of email addresses. We do the rest.
Your people respond
The survey goes to the whole organisation - not a sample. It takes 10-15 minutes. Forty scored statements across eight dimensions, plus open questions where people write in their own words.
We work with you to manage reminders and response rates, so the data represents the organisation rather than just the people who respond first.
The systems and processes I rely on help me get my work done, rather than getting in the way.
Responses are anonymous. No individual can be identified in the results. Where a group has fewer than five respondents, the dashboard suppresses the data entirely rather than showing it.
Data is processed in the UK/EU, encrypted in transit and at rest.
The survey is designed to be completed on any device. No app to install, no account to create.
You get your dashboard
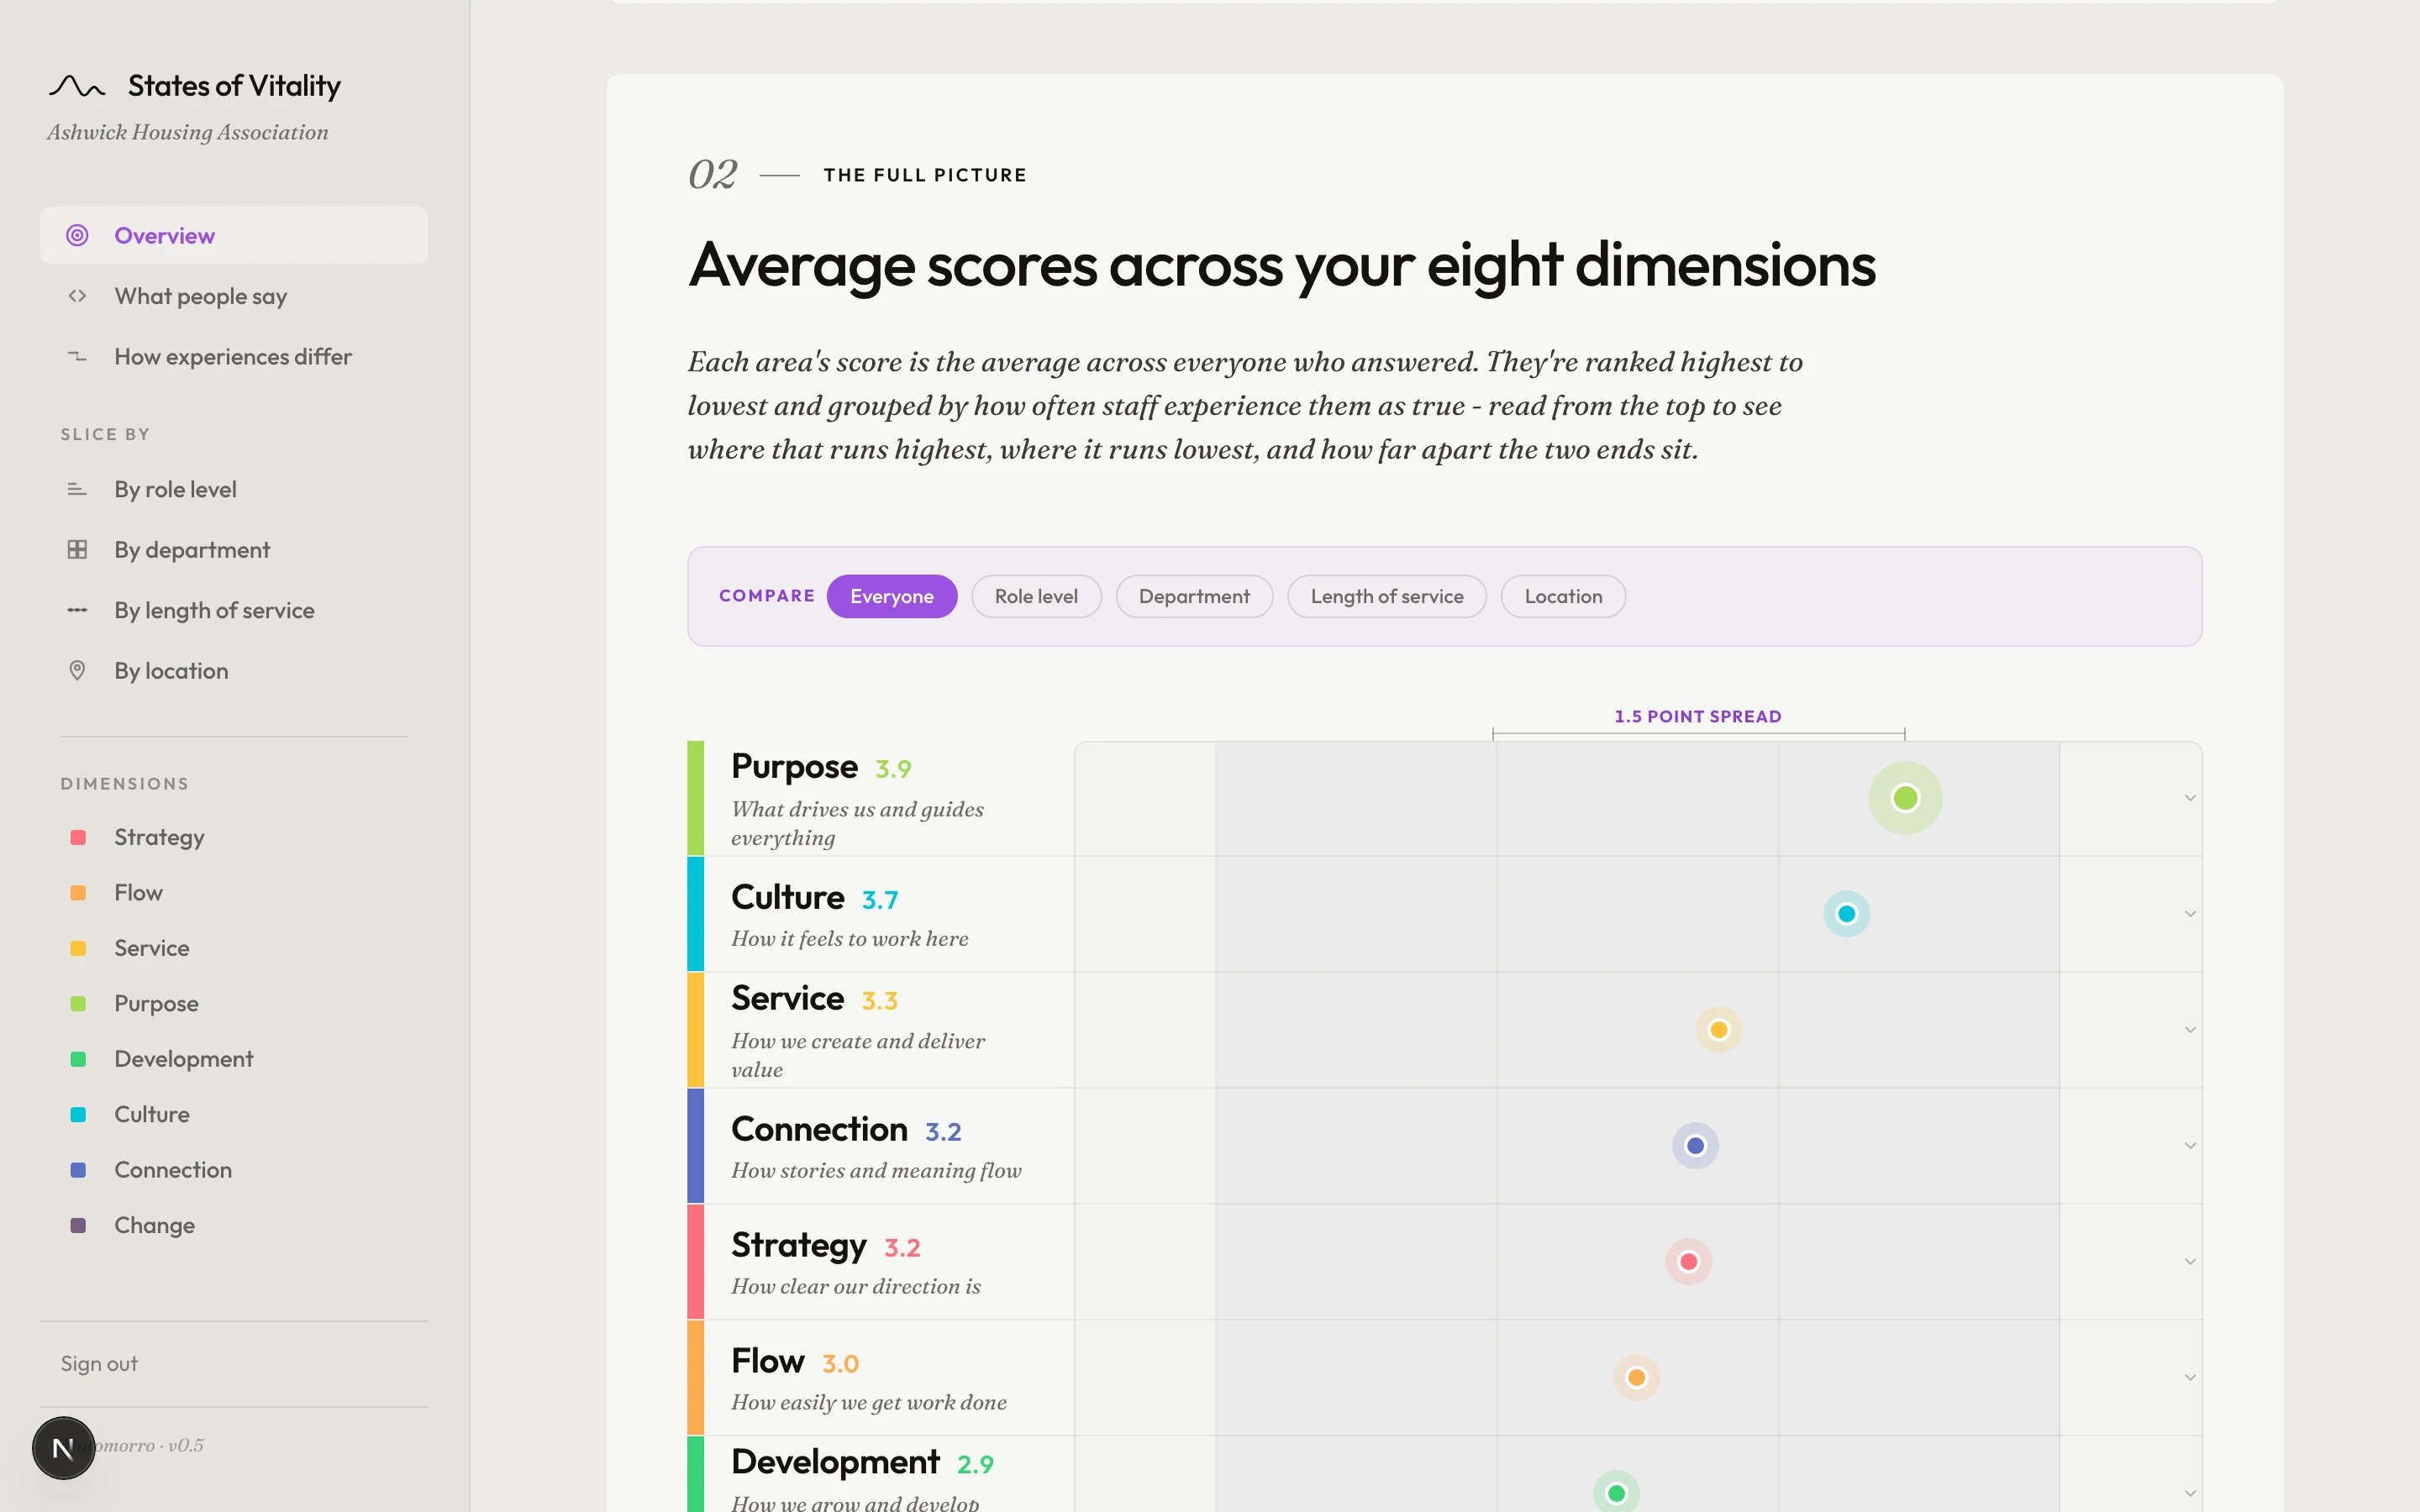
Results arrive in an interactive dashboard - the shape of your organisation's health across eight dimensions, the patterns underneath, the perception gaps between groups, and what people wrote in their own words.
It is yours to explore, filter and share. Every view generates a link, so a conversation about a specific finding can start from the same picture.
Go further, if you want
The dashboard gives you the picture. What you do with it is up to you.
Some organisations take the data and run with it - they have the internal capability and just needed the clarity. Others want help making sense of what the data is showing, and that is where we come in: facilitated sessions with leadership teams, deeper analysis across specific dimensions or groups, and support building a plan from what the data says.
What every assessment includes
- A configured survey tailored to your organisation
- The interactive dashboard with all eight dimensions
- Freeform responses in people's own words
- Demographic analysis by role level, department, tenure and location
- A shareable link for every view
- In-depth analysis across specific dimensions or groups
- Facilitated sessions with leadership teams
- A development and action plan
For organisations that want to track progress, we run annual or quarterly snapshots so you can watch how the picture changes.
Ready to talk about an assessment for your organisation?
We can walk through scope, timing and price.