See the ground clearly, before the transformation begins
Every transformation starts with a plan, and most plans rest on an assumption of how the organisation actually works. States of Vitality reads the ground first - where it is solid, where it is thin, and where the appetite for change is already stretched - so the plan meets the organisation as it is, not as it is imagined.
What's hardest to see
Whether a transformation lands depends as much on the reality it meets as on the plan itself - and that reality is uneven in ways that are genuinely hard to see.
Two departments following the same plan can be in very different places: the trust they start from, the change they are already carrying, the capacity they have left to take on more. None of it shows up on an org chart, and it rarely surfaces until the change is already underway. That is the part most worth seeing early.
say change fatigue is the biggest barrier to change in their organisation.
A transformation rarely fails on the plan. It fails on the capacity to absorb it.
What States of Vitality shows you
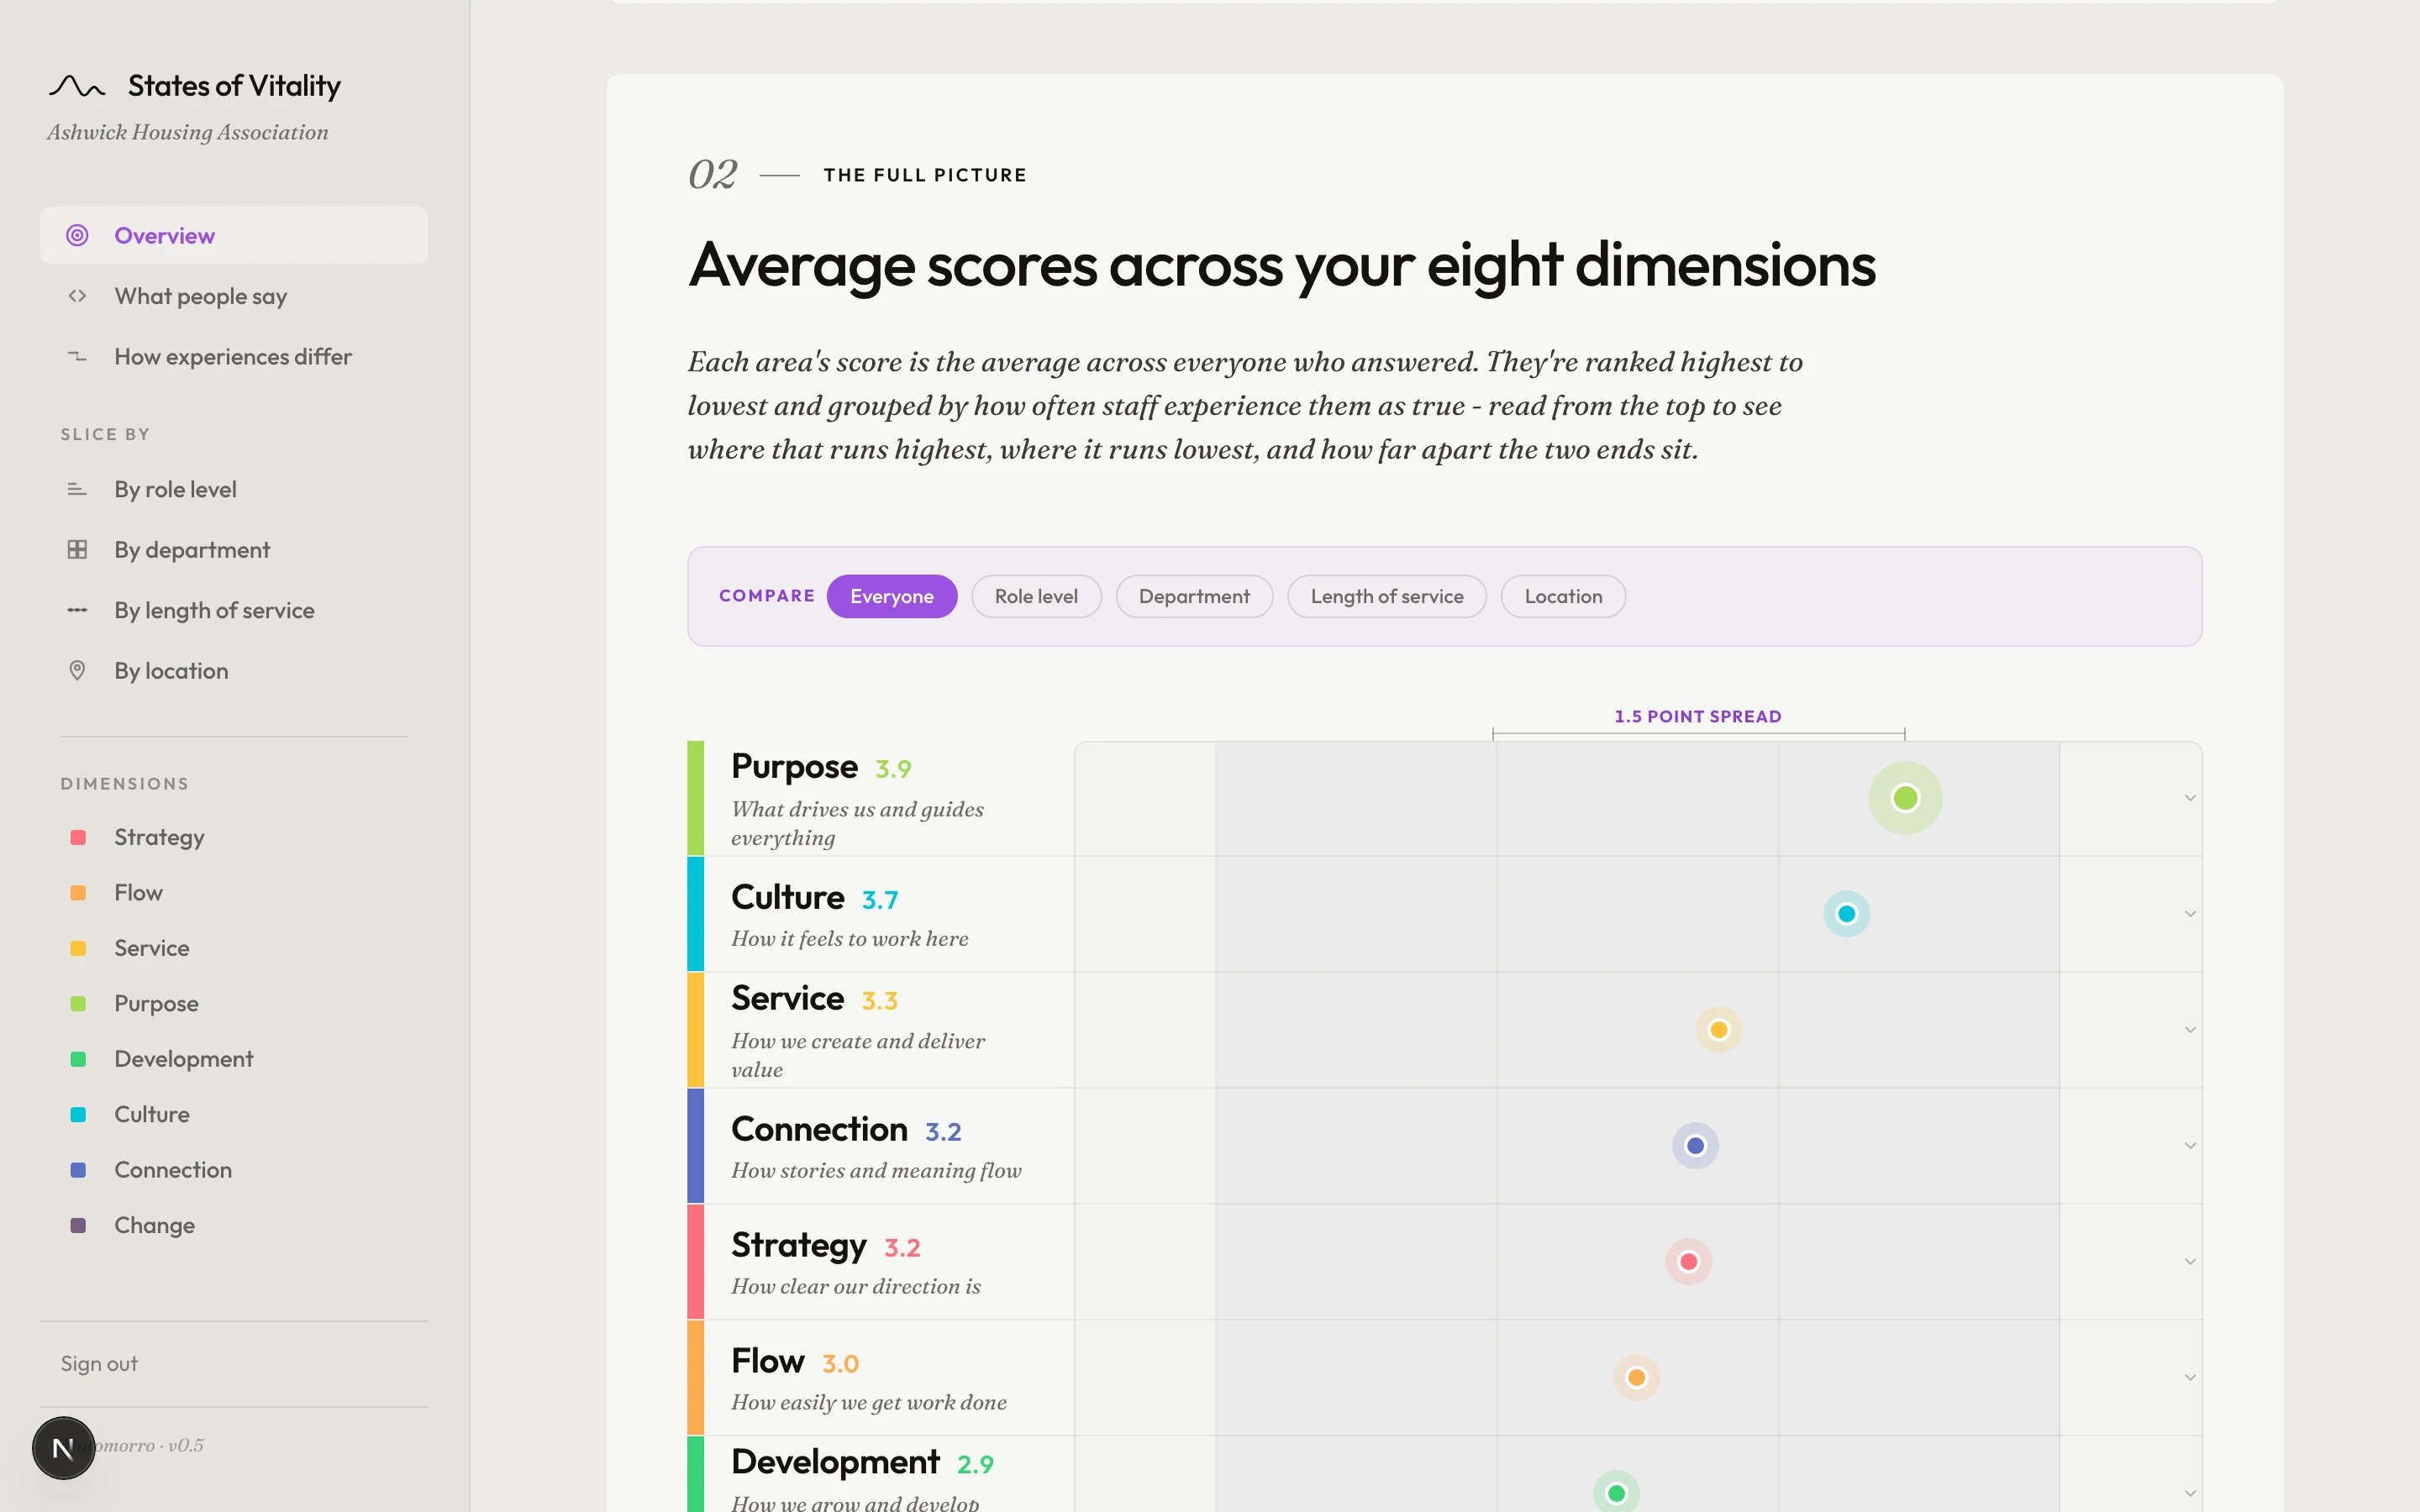
Change succeeds or stalls on conditions that are already in the organisation before the plan arrives. We read eight of them across the whole workforce - how cohesive the strategy feels, so the change has something to attach to; whether there is any capacity left in the flow of work to absorb something new, or whether people are already at their limit; how change has tended to land here before, in confidence or in fatigue; and the trust and connection that decide whether a change spreads or stalls.
Each is scored, ranked and broken down by group - so you see not just readiness overall, but how far it varies from one part of the organisation to the next, and how the view from the top compares with the view from the front line.
What you'd see in the dashboard
Every dimension scored and ranked, so you can see which foundations are solid and which will strain under change.
A heatmap of every group against every area, surfacing where readiness for change is most uneven.
The view from the top set against the view from the front line, so the plan isn't built on the leadership view alone.
What people wrote themselves about how change tends to land here, read directly rather than summarised away.
Planning a transformation?
We can talk through what a read of the organisation would look like before you begin - scope, timing and price.